
User Guide
Responding to an Incident
When you receive a notification for a new incident, click on the notification to bring up the app, and it will take you straight to the details page for the new incident. On this page you can view the incident details at the top, and a list of responders at the bottom. Click on one of the three response buttons at the bottom to enter your response -- Unavailable, Available or En Route. Once you enter a response, others will be able to see it immediately in the response list.Other features you will find on the incident detail page:
- Globe Icon (top right): Click this to bring up the maps app showing the GPS location contained in the dispatch.
- Three dot menu (top right): The "Show Raw Cad Page" menu item will bring up a screen showing the raw cad page(s) for this incident.
- Click on the "Time" column of the responses list to see the time each user entered their response (the column title will change to "Entered"). Click again to toggle back to ETA times.
- If the address appears as a hyperlink (underlined blue text), that means that there have been previous incidents at this address. Click on the text in order to bring up the list of previous incidents at this address.
- On the incident details, press and hold the text of the "Time" field to bring up a tooltip which shows the delay time between the CAD dispatch and the IR app server receiving the CAD email.
Search and Charts
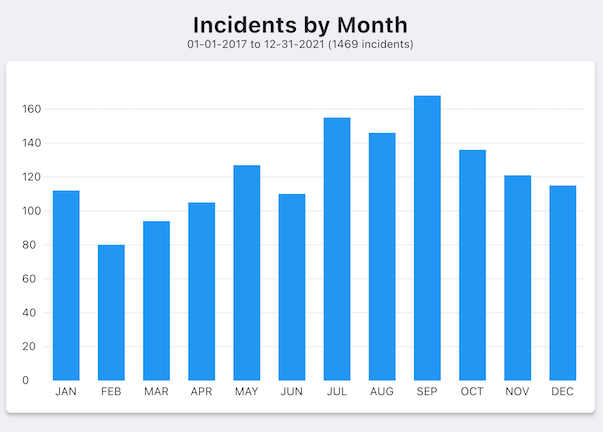
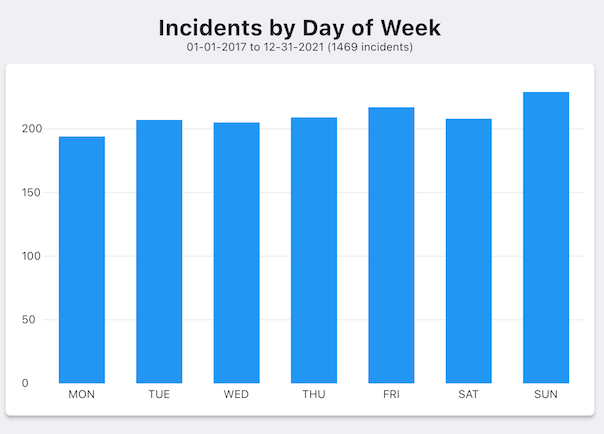
Version 2.5 has a new "Search" tab, which allows users to search all previous incidents for this department, using a variety of search parameters including date range, call type, and various incident fields such as description, details, resources, etc. You can also search by responder attendance. The results of the search are displayed as a list or as charts, where you can view the results as a variety of bar charts, showing the distribution of incidents by year, month, day of week, time of day, town, etc. It is reccommended to view the charts on a larger device such as a tablet, so that the details of the chart don't get lost on a small screen. You can then screenshot the tables and share them with your department for end of year reports, for example. A few example charts are shown here: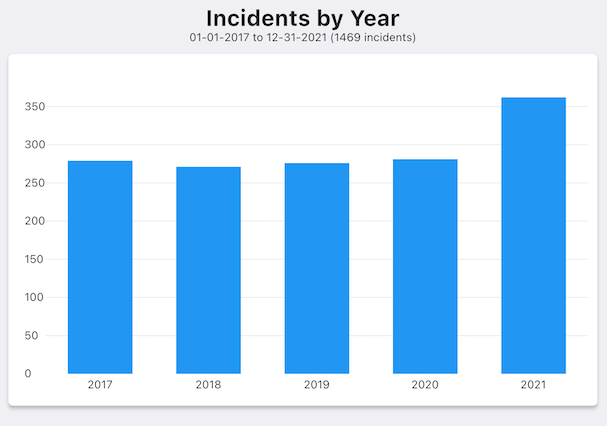 |
 |
 |
Some tips for using the search feature:
- When adding a custom search filter, you most often will want to use the CONTAINS operator, since it doesn't require an exact text match, so you can enter a shorter search phrase than if the exact match was required (as it is with the EQUALS operator). For example, if you want to search for all incidents where a responder named "Gozzendorfer, F" attended, you can just add a custom search filter Responder CONTAINS "gozz" (as long as "gozz" is unique among your department's responder names). That's much easier than Responder EQUALS "gozzendorfer, f", which will give the same results.
- Click on a bar to see the exact count of incidents for that bar, and then drag you finger left or right to see the counts for each bar.
- The search text is not case sensitive, so it's easiest to just use lowercase for all search text.
- If you do an "or" search, an extra chart will show the breakdown of each element in the list of or-ed values. For example, if you search Description CONTAINS "alpha or bravo or charlie or delta or echo", you will get a chart that breaks down all incidents with each of those words.